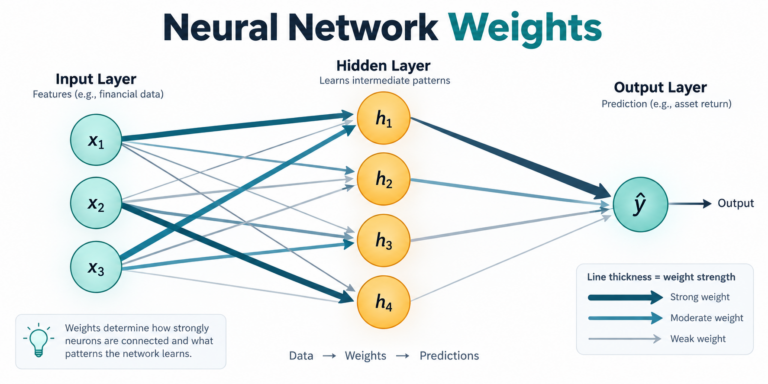
Graph Neural Networks, or GNNs, are a class of neural networks designed to learn from connected data. Instead of treating every data point as isolated, a GNN studies both the individual object and the relationships around it.
That makes GNNs interesting for trading research because markets are naturally connected. Stocks are linked through sectors, supply chains, ownership, correlations, news, macro exposure, and investor behavior. A traditional model may study one asset’s price history. A GNN can study how that asset sits inside a wider market network.
What Is a Graph Neural Network?
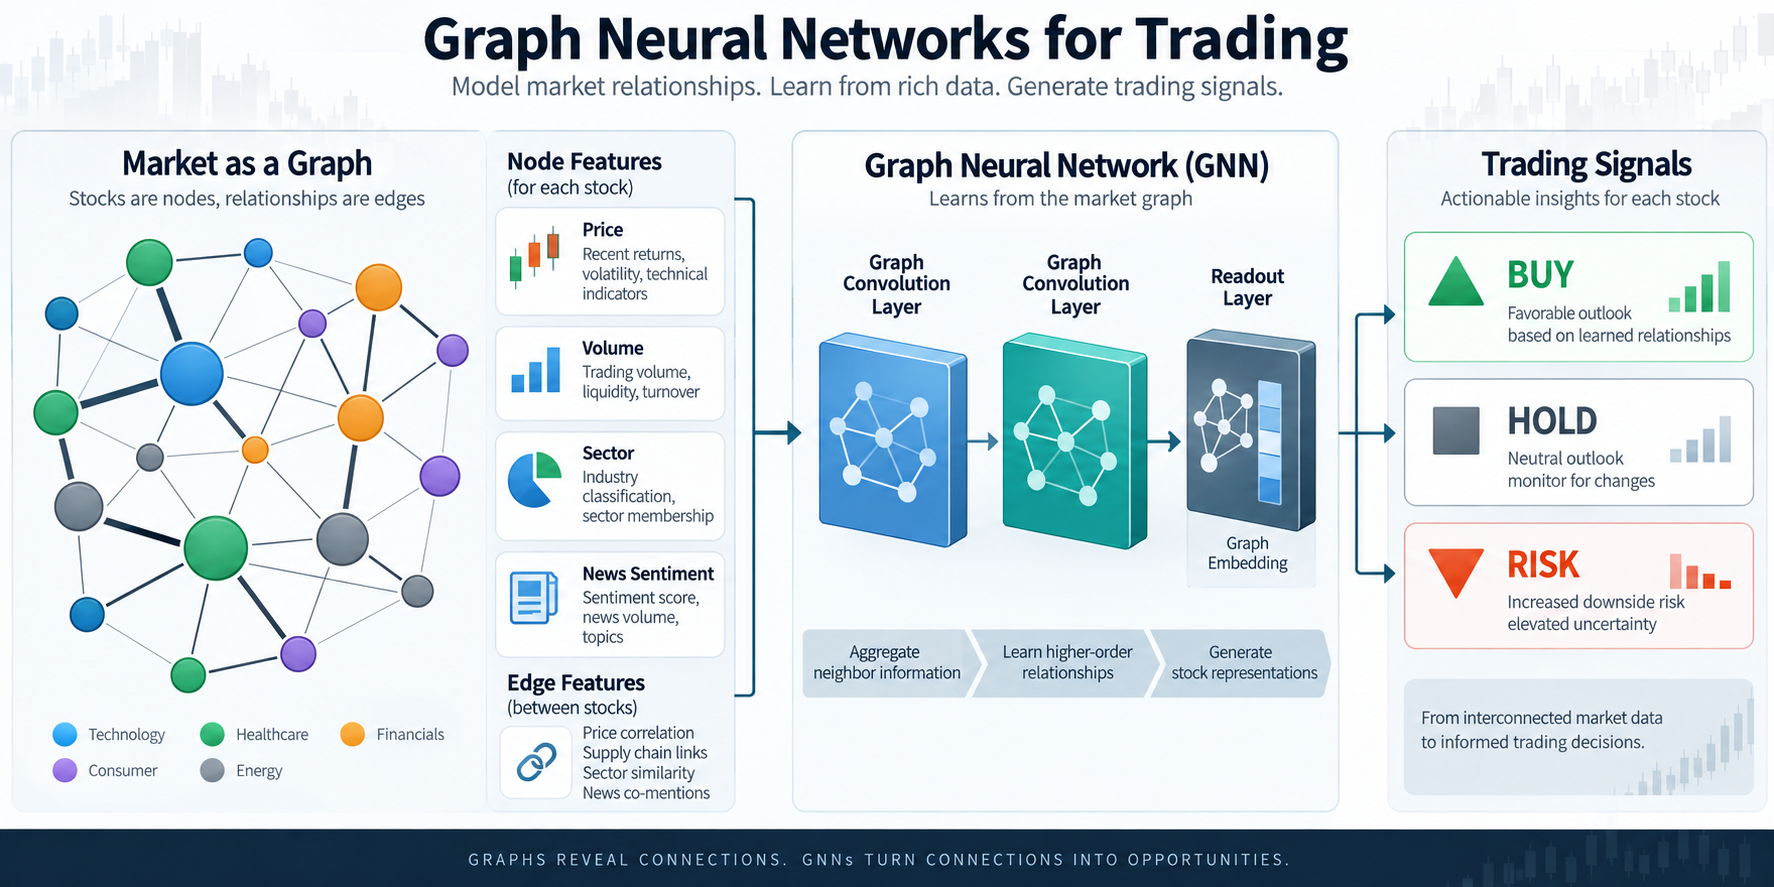
A graph is made of nodes and edges. Nodes are the objects being studied. Edges are the relationships between those objects.
In a social network, people are nodes and friendships are edges. In a financial market graph, stocks, sectors, companies, currencies, or assets can be nodes. Correlations, sector membership, supply-chain links, shared news events, or capital flows can be edges.
A GNN learns by passing information across those edges. Each node updates its representation using its own features and information from its neighbors. After several rounds of this process, the model can learn higher-level patterns across the network.
Why GNNs Fit Trading Problems
Financial markets are not collections of independent assets. A bank stock may react to interest rates, credit conditions, other banks, broad index movement, and investor risk appetite. A semiconductor stock may react to suppliers, customers, export rules, chip demand, and related technology names.
GNNs are useful because they let a model represent those dependencies directly. Instead of asking only, “what does this stock’s chart look like?” a GNN can ask, “how is this stock connected to other stocks, and what are those connected assets doing?”
How a Trading GNN Can Be Built
A basic GNN trading pipeline might look like this:
- Define the nodes, such as stocks, ETFs, sectors, or crypto assets.
- Define the edges, such as correlations, sector links, supply-chain relationships, or news co-mentions.
- Add node features, such as returns, volatility, volume, liquidity, valuation metrics, or sentiment scores.
- Train the GNN to predict a target, such as next-period return direction, volatility regime, relative strength, or risk state.
- Convert the model output into a research signal, risk input, or portfolio-ranking tool.
The model output should not be treated as an automatic buy or sell command. In serious trading research, it still needs validation, transaction-cost analysis, stress testing, and risk controls.
Examples of Market Relationships
The most important design choice is the graph itself. A weak graph gives the model weak structure. A useful graph gives the model meaningful relationships to learn from.
Common graph relationships in trading research include:
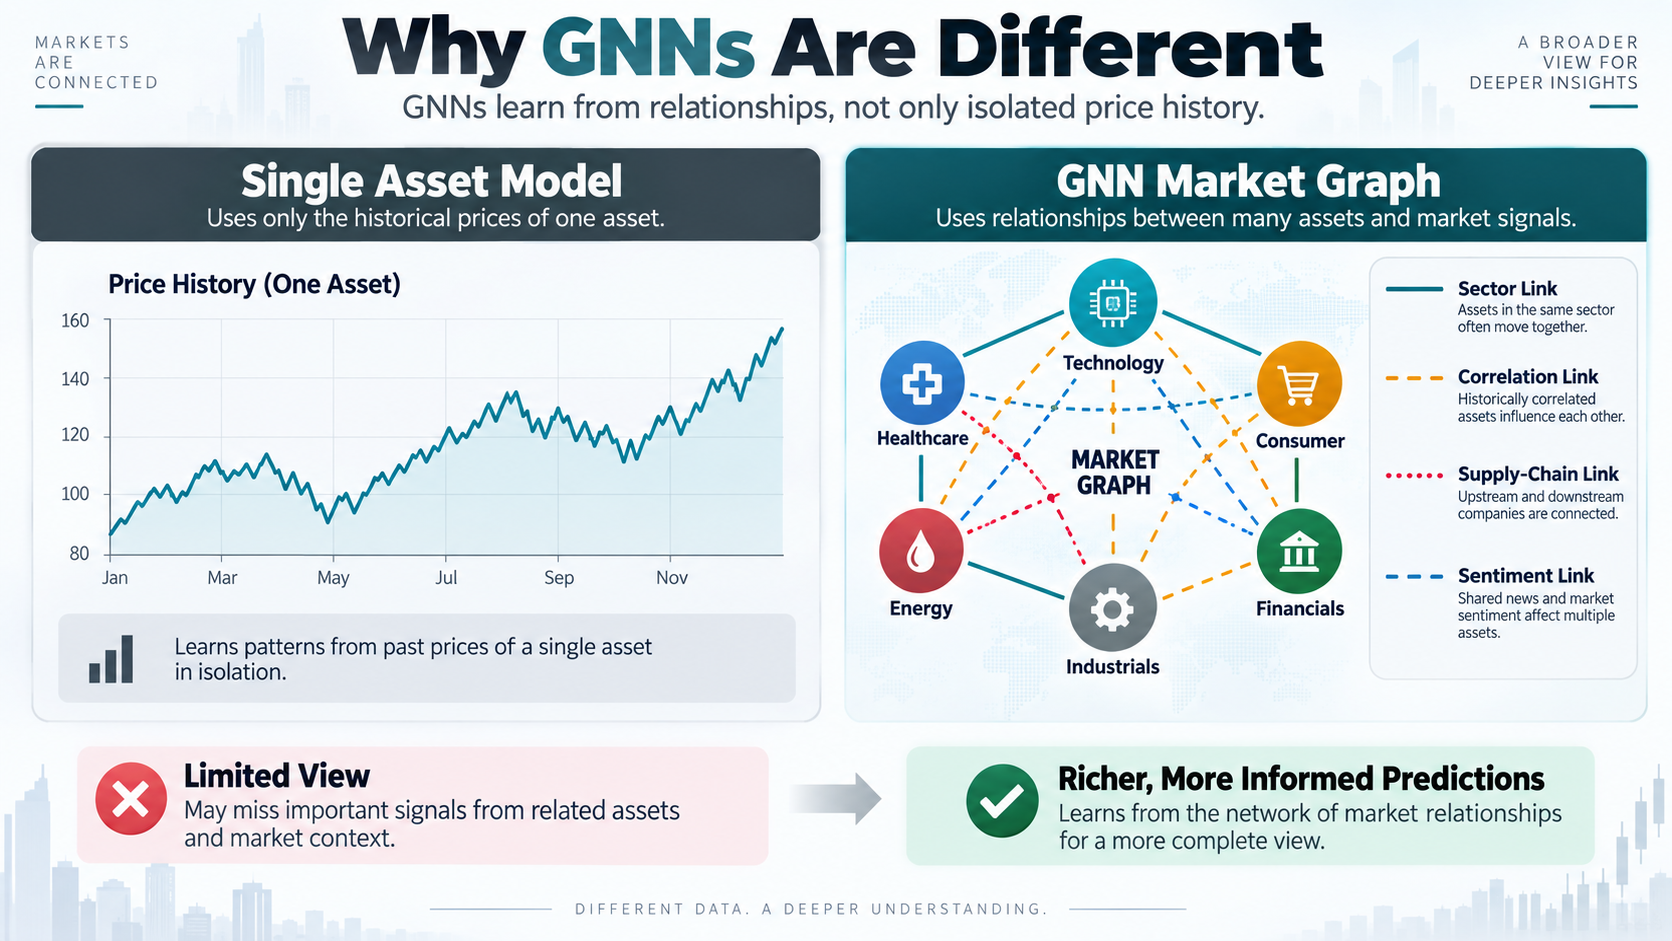
- Correlation links: assets that historically move together.
- Sector links: companies in the same industry or economic group.
- Supply-chain links: companies connected as suppliers, customers, or competitors.
- News links: assets mentioned in the same events, articles, or themes.
- Ownership links: assets connected through institutional holdings or fund exposure.
- Lead-lag links: assets where movement in one may precede movement in another.
GNNs vs. Traditional Time-Series Models
Traditional trading models often treat an asset as its own time series. They study price, volume, indicators, and maybe macro variables. That can work, but it may miss information from related assets.
A GNN adds a second dimension: relationship structure. If several connected assets begin showing stress, the model can use that network information when updating the representation of each asset.
This does not make GNNs automatically superior. A simpler model can beat a complex one if the data is cleaner, the validation is stronger, or the trading cost assumptions are more realistic. GNNs are powerful, but they also add design risk.
Possible Trading Uses
GNNs can support several research tasks:
- Stock movement prediction: estimating whether an asset is more likely to rise, fall, or underperform.
- Portfolio ranking: scoring assets relative to peers inside a market graph.
- Risk detection: identifying clusters of assets where stress may spread.
- Sector rotation: learning how relationships between industries change across regimes.
- Event analysis: measuring how news or shocks propagate through connected companies.
- Pairs and basket research: finding groups of assets with useful relationship patterns.
Benefits of GNNs in Trading
The main advantage of GNNs is context. A GNN does not only look at one asset’s features. It can also learn from connected assets and from the structure of the market graph.
This can help when relationships matter more than isolated price history. For example, a company’s suppliers may weaken before the company itself reacts. A sector may show stress before an individual stock breaks down. A news event may affect several related companies at once.
Limitations and Risks
GNNs are not a shortcut to easy trading profits. Financial markets are noisy, non-stationary, and competitive. A relationship that worked in the past can disappear. A graph that looks logical may not improve out-of-sample performance.
Key risks include:
- Overfitting to historical relationships.
- Using stale correlations that fail in new market regimes.
- Ignoring transaction costs, slippage, and liquidity.
- Building graphs that accidentally leak future information.
- Confusing prediction accuracy with real trading profitability.
The last point matters. A model can look accurate in a research notebook but still fail once trading costs, execution constraints, and risk limits are included.
How to Think About GNNs Practically
The best way to view GNNs is as research tools for connected markets. They can help organize market structure, discover relationships, and build richer signals. But they should be tested with the same discipline as any other trading model.
A practical workflow should include walk-forward testing, clean train-test splits, strict prevention of data leakage, realistic transaction costs, and comparison against simple baselines. If a GNN cannot beat a simpler model after costs and risk controls, the extra complexity may not be worth it.
Final Thoughts
Graph Neural Networks are important because they match the shape of financial markets. Markets are networks, not isolated lines on a chart. Assets influence each other through sectors, supply chains, correlations, sentiment, and shared macro forces.
For trading, that makes GNNs a promising research direction. They can model relationships that ordinary time-series models may miss. But their value depends on graph design, data quality, validation, and execution realism.
Used carefully, GNNs can help traders and researchers move from isolated prediction toward network-aware market understanding.
Sources and Further Reading
- A survey of graph-based approaches in stock market analysis and prediction
- Machine learning in stock market forecasting: a comprehensive review
- Modeling hybrid firm relationships with graph neural networks for stock investment decisions
This article is educational and does not provide financial advice or a trading recommendation.